
Insights & Reports
Fourthline Hub
Insights dashboards help you track verification activity, identify trends, and make data-driven decisions.
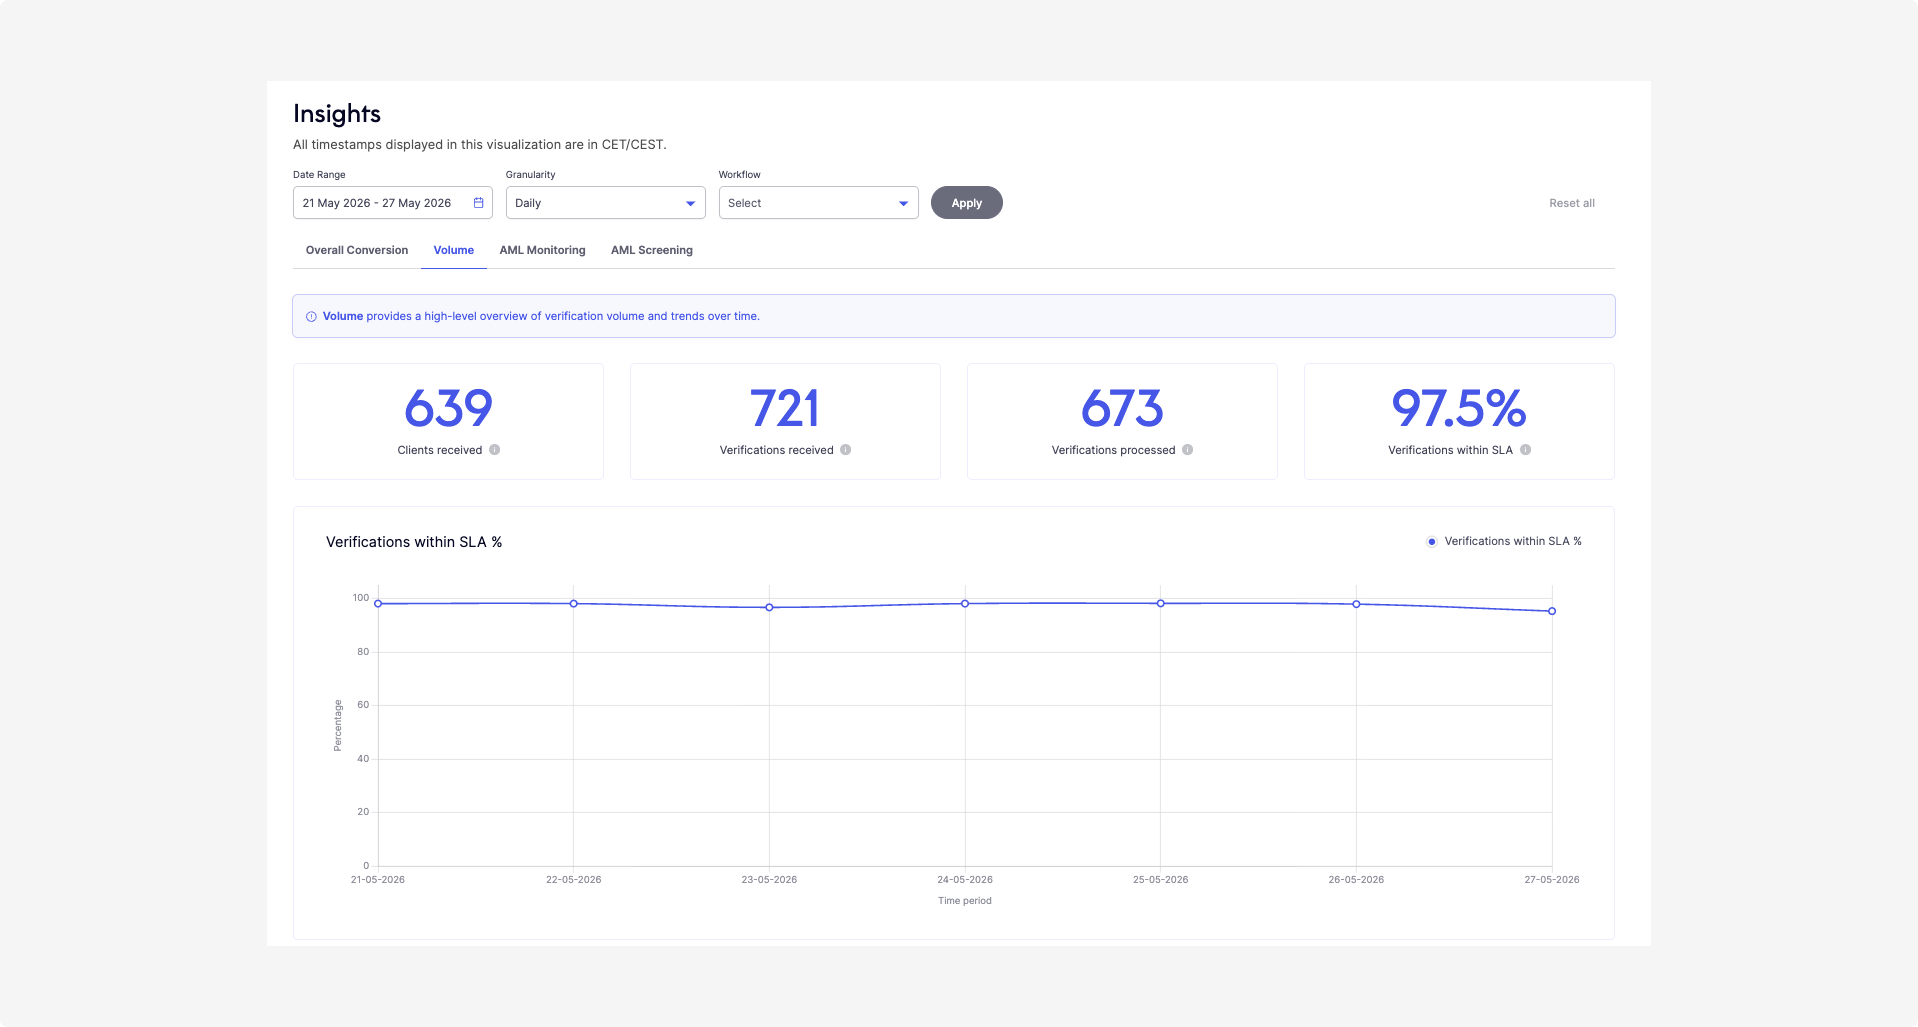
Hub Insights Dashboard
Graphs & metrics
Explore interactive graphs that provide insight into key business metrics over time. The dashboards help you track client flow, monitor processing throughput, and spot performance trends at a glance.
Graphs are grouped into the following tabs:
Each tab contains summary cards and graphs. The summary cards, located at the top of the page, display the total or average for each metric.
The graphs show how the metrics change over the selected date range. Hover over a data point to view a tooltip with the metric definition.
To get started:
- Log in to Hub.
- Make sure you have the Base access role to access this page.
- Check if you are in the Sandbox or Production environment.
- Go to Insights and select the dashboard you want to explore. All data in the Sandbox environment is synthetic and illustrates how data may appear in Production.
The dashboards give you a visual overview of aggregated verification activity over time.
Overall Conversion
The Overall Conversion tab shows how verifications progress through your onboarding funnel and where drop-offs occur.
| Metric | Description |
|---|---|
| End-to-end conversion rate | Shows the percentage of verifications in which the client completed the frontend workflow and the backend produced a verdict, out of all verifications received. |
| Clients conversion rate (backend) | Shows the percentage of clients with at least one verification that reached a final verdict (green, red, or yellow), out of all clients received. |
| Verifications conversion rate (backend) | Shows the percentage of processed verifications with a final verdict (green, red, or yellow), out of all verifications received. |
| Average verification attempts per client | Shows the average number of verification attempts per unique client. This metric is only available as a summary card. |
| Top reasons for rejection | Shows the most common reasons why processed verifications did not result in a success status. |
Volume
The Volume tab provides a high-level overview of verification volume and trends over time.
| Metric | Description |
|---|---|
| Verifications within SLA % | Shows the percentage of verifications completed within the SLA timeframe. |
| Clients graph | Shows activity at the client level: • Received bar: Unique client IDs with at least one verification ready for processing. • Processed bar: Unique client IDs with at least one verification that reached a verdict. |
| Verifications graph | Shows activity at the verification level: • Received bar: Unique verification IDs ready for processing (client actions complete, validation can start). • Processed bar: Verification IDs that reached a final verdict (green, red, or yellow status). See Verification statuses. To hide or show data series, select Received or Processed in the chart legend. |
Axes
- Y-axis: Total number of verifications.
- X-axis: Date each verification was received (applies to both received and processed counts).
Example
A verification ID is received on 20-01-2025. It is processed on 22-01-2025.
In Hub:
- It counts as received on 20-01-2025.
- It counts as processed on 20-01-2025.
- It does not count as processed on 22-01-2025.
AML Monitoring
The AML Monitoring tab shows the results of daily checks that identify whether your clients match new or updated entries in the configured AML databases.
Filter the data by Hit category to view data by AML hit category, such as sanctions or PEP.
| Metric | Description |
|---|---|
| Total clients monitored | Shows the total number of enabled clients monitored against the configured AML databases. |
| Clients with potential hits | Shows the total number of clients with potential matches identified in AML databases that require review. |
| Confirmed hits | Shows the total number of clients manually verified and confirmed to match an existing record in one or more configured AML databases. |
| False positives | Shows the total number of potential hits that were manually reviewed and determined not to be true matches. |
| Pending manual investigation | Shows potential hits awaiting manual review through forensic open-source investigation, which remain as potential hits until confirmed or marked as false positives. |
| Hit trends | Shows trends showing potential hits, confirmed hits, and false positives over time. |
| Manual investigation trends | Shows the number of new potential hits requiring manual investigation over time. |
AML Screening
The AML Screening tab shows the results of a one-time check against sanctions lists, PEP, and adverse media sources.
Filter the data by Hit category to view data by AML hit category, such as sanctions or PEP.
Filter by Nationality to view data by client nationality.
| Metric | Description |
|---|---|
| Total clients screened | Shows the total number of clients screened as part of a one-time screening exercise in the selected period. |
| Clients with potential hits | Displays the total number of clients with potential matches identified in AML databases. |
| Confirmed hits | Indicates the total number of clients manually verified and confirmed to match an existing record in one or more configured AML databases. |
| False positives | Represents the total number of potential hits that were manually reviewed and determined not to be true matches. |
| Pending manual investigation | Identifies potential hits awaiting manual review through forensic open-source investigation. These remain potential hits until confirmed or marked as false positives. |
| Screening trends | Illustrates trends showing potential hits, confirmed hits, and false positives over time. |
| Manual investigation trends | Shows the number of clients that required manual investigation over time. |
Data freshness
Data freshness refers to how up-to-date the data is. It measures the time gap between when data is generated or collected and when it becomes available for use.
In Hub, data is available starting from the previous day onward. This means today’s data will be visible tomorrow, typically within the first hour after midnight (00:00 UTC) and no later than 06:40 UTC.
Filters
Use filters to customize your view and explore trends.
- Date range: Filter data within the selected range.
- Workflow: Filter data for a specific workflow or branch.
- Date granularity: Choose how to group data on the graph:
| Granularity | Description |
|---|---|
| Hour | 08:00 represents the time range 08:00–08:59 CET/CEST |
| Day | Calendar day (00:00–23:59 CET/CEST) |
| Week | Monday to Sunday (calendar week, not rolling 7 days) |
| Month | From the first to the last day of the calendar month |
| Quarter | Calendar quarter (e.g., Q1 = Jan 1–Mar 31) |
| Year | Full calendar year (e.g., 2025 = Jan 1–Dec 31) |
To apply filters, select Apply.
Reports
Hub lets you download security reports as PDF files. Security reports are available from 2025 onwards. Reports from before 2025 are not available in Hub.
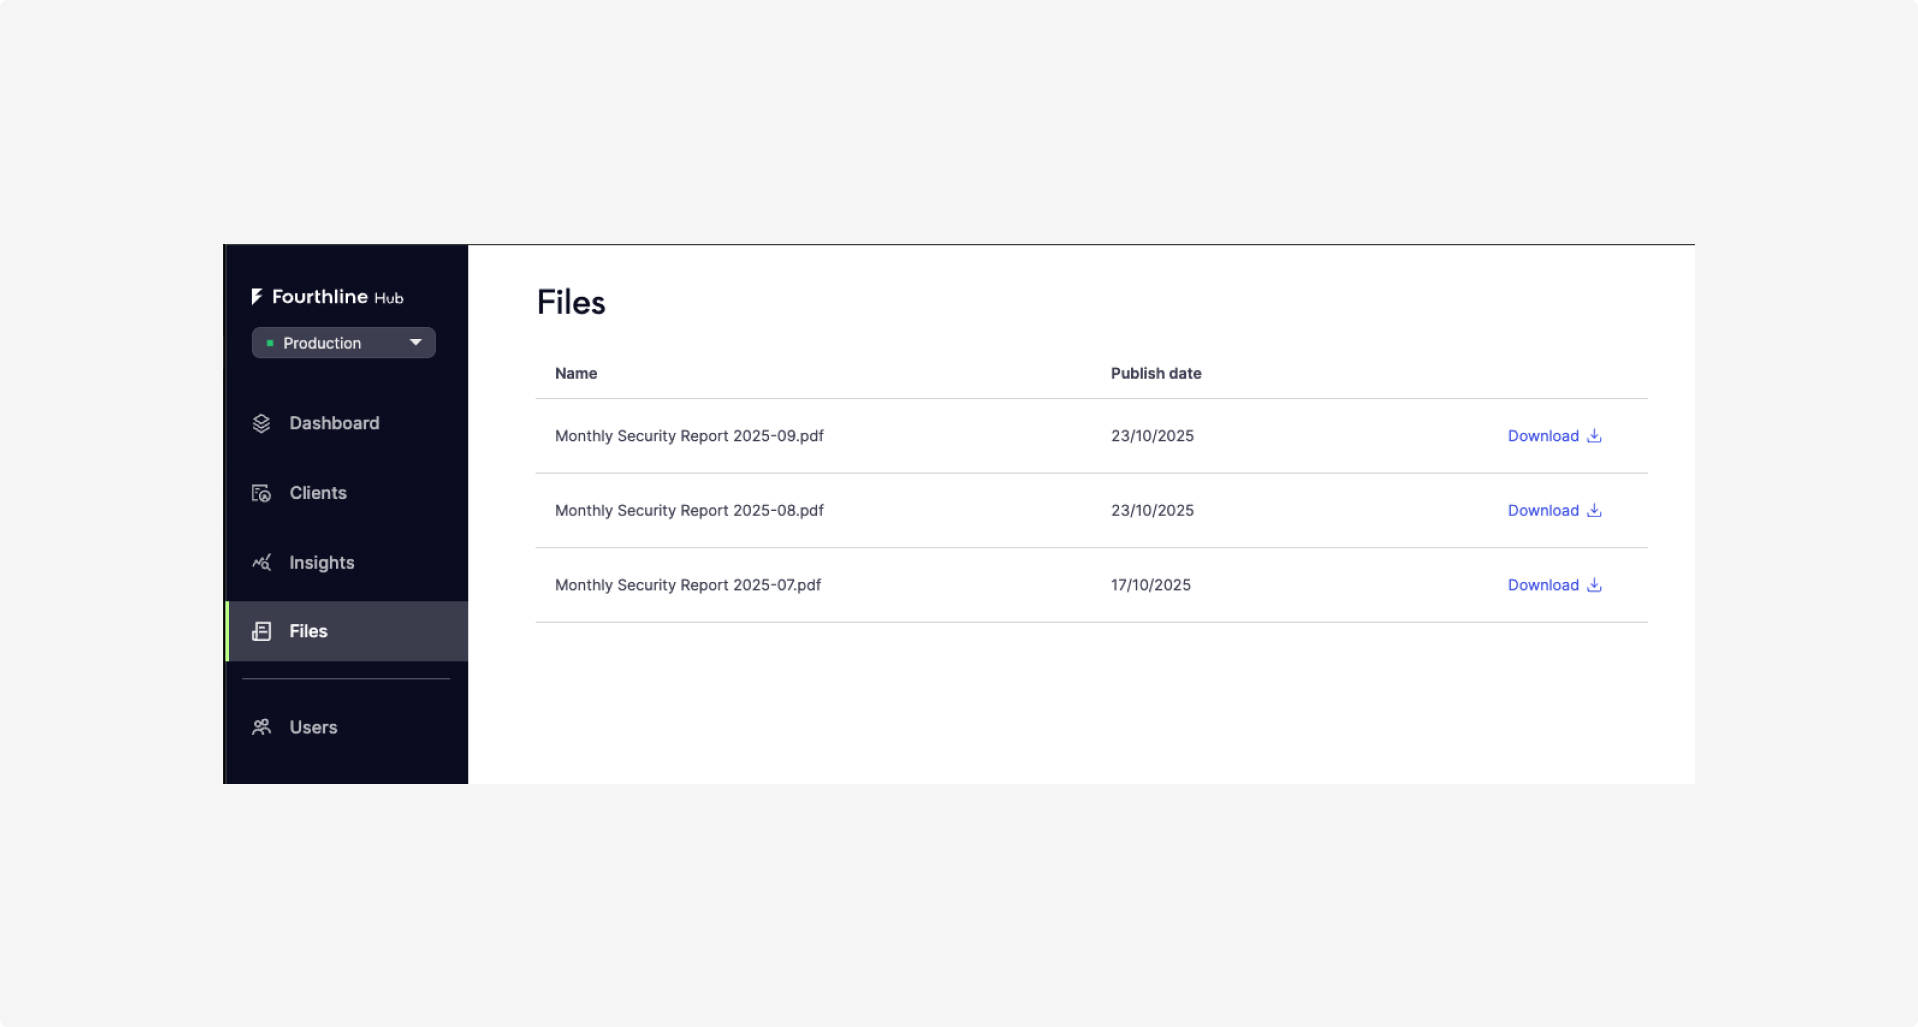
Hub Files
If your organisation has a signed commercial agreement with Fourthline, any user with the Base access role can download reports containing actual data, including monthly reports from Fourthline’s Security team and third-party pentest reports.
If your organisation does not have a commercial agreement, you can only download a sample report with mocked data.
To download a report:
- Navigate to Hub.
- Select Files. Files are sorted by published date, with the most recent report shown first.
- Select a report and choose Download.

Updated 19 days ago